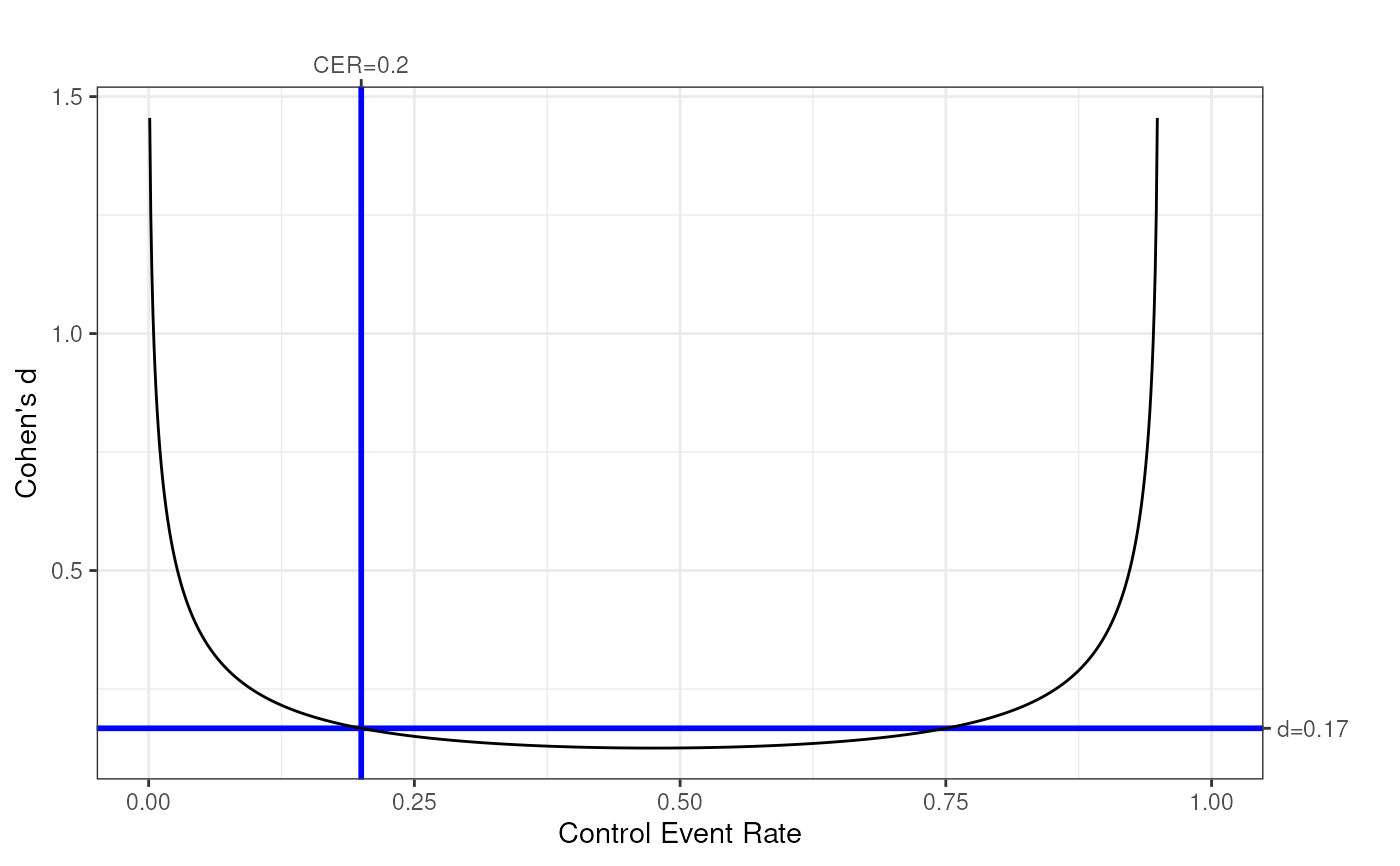
This function uses a base rate (Control Event Rate, argument cer) and a
Meaningful Change Definitions (MCD, argument mcd) to compute the
corresponding Cohen's d. See Gruijters & Peters (2019) for details.
dMCD(
  cer,
  mcd = NULL,
  eer = NULL,
  plot = TRUE,
  mcdOnX = FALSE,
  plotResultValues = TRUE,
  resultValueLineColor = "blue",
  resultValueLineSize = 1,
  returnLineLayerOnly = FALSE,
  theme = ggplot2::theme_bw(),
  highestPossibleEER = 0.999999999,
  xLab = ifelse(mcdOnX, "Meaningful Change Definition", "Control Event Rate"),
  yLab = "Cohen's d",
  dist = "norm",
  distArgs = list(),
  distNS = "stats",
  ...
)

# S3 method for dMCD
print(x, ...)
Arguments
- cer
The Control Event Rate (or base rate): how many people already perform the target behavior in the population (as a proportion)?
- mcd
The Meaningful Change Definitions: by which percentage (as a proportion) should the event rate increase to render an effect meaningful?
- eer
Instead of the MCD, it is also possible to specify the Experimental Event Rate (EER), in which case the MCD is computed by taking the difference with the CER.
- plot
Whether to show a plot.
- mcdOnX
Whether to plot the Meaningful Change Definition on the X axis (by default, the CER is plotted on the X axis).
- plotResultValues
Whether to plot the result values.
- resultValueLineColor, resultValueLineSize
If plotting the result values, lines of this color and size are used.
- returnLineLayerOnly
Whether to only return a layer with the plotted line (which can be used to quickly stack lines for different MCDs).
- theme
The
ggplot2theme to use.- highestPossibleEER
The highest possible EER to include in the plot.
- xLab, yLab
The labels for the X and Y axes.
- dist, distArgs, distNS
Used to specify the distribution to use to convert between Cohen's d and the CER and EER. distArgs can be used to specify additional arguments to the corresponding
qandpfunctions, and distNS to specify the namespace (i.e. package) from where to get the distribution functions.- ...
Any additional arguments to dMCD are passed on to the
ggplot2::geom_lineused to draw the line showing the different Cohen's d values as a function of the base rate (or MCD) on the X axis. Additional arguments for the print method are passed on to the default print method.- x
The object to print (i.e. a result from a call to dMCD).
Value
The Cohen's d value, optionally with a ggplot2 plot stored in an
attribute (which is only a ggplot2 layer if returnLineLayerOnly=TRUE).
References
Gruijters, S. L. K., & Peters, G.-J. Y. (2020). Meaningful change definitions: Sample size planning for experimental intervention research. PsyArXiv. doi: 10.31234/osf.io/jc295
Examples
dMCD(.2, .05);
#>      mcd
#> cer        0.05
#>   0.2 0.1671315
