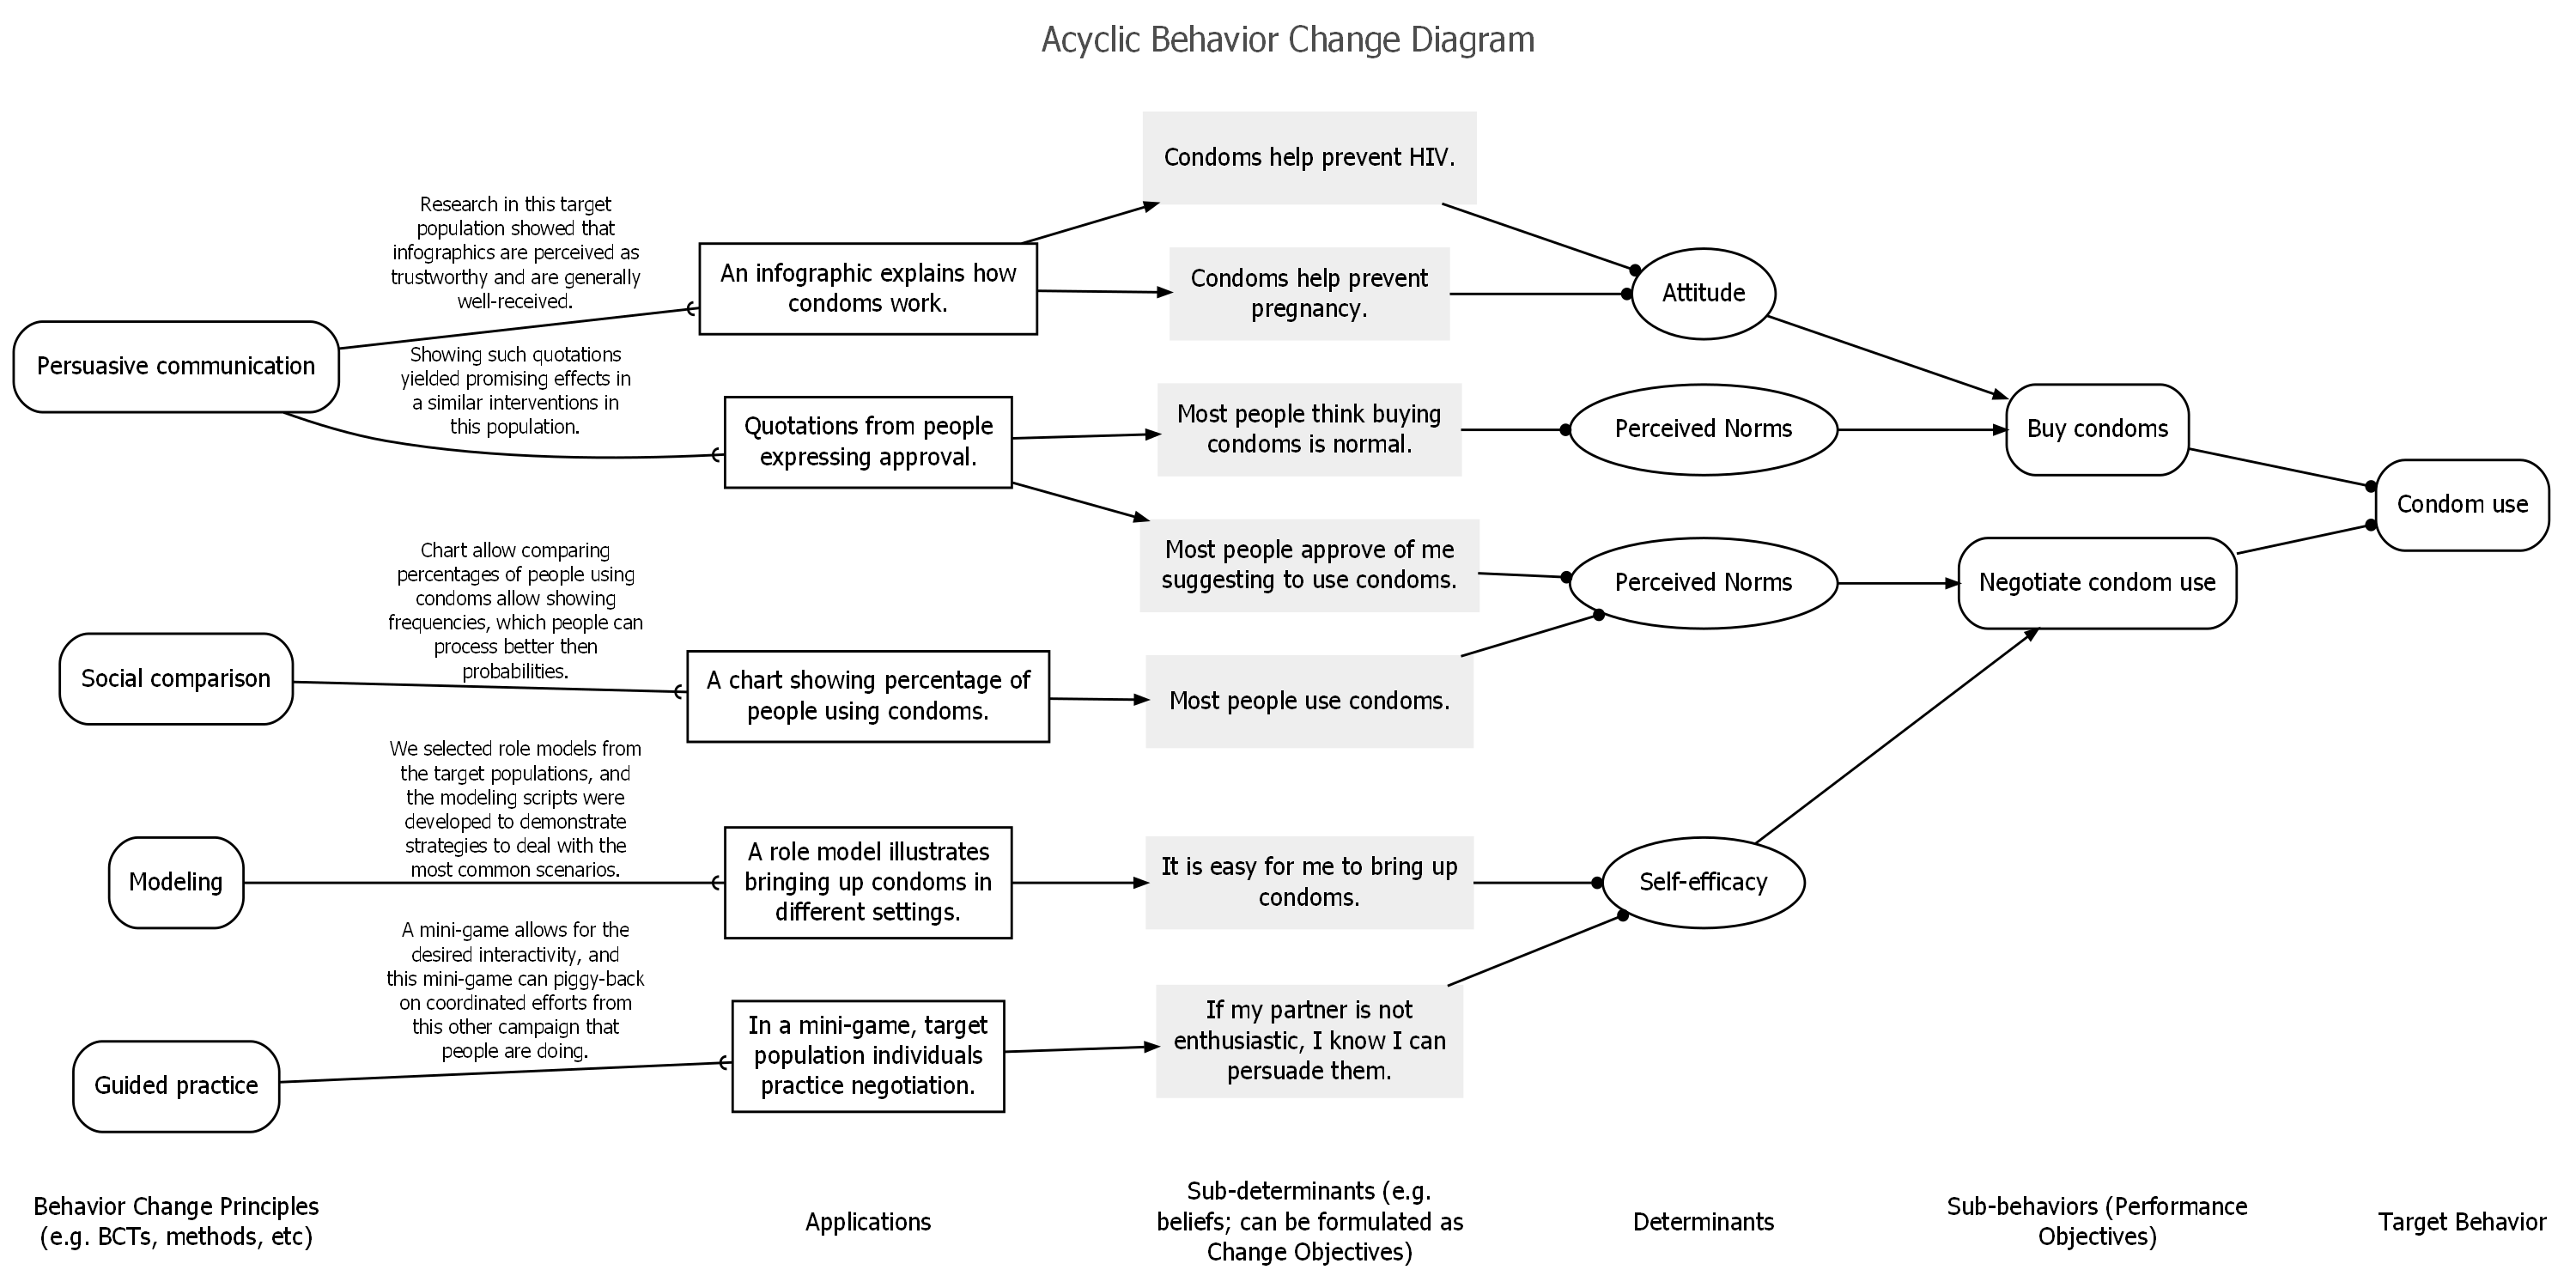
Acyclic Behavior Change Diagrams (ABCDs) are diagrams that illustrate the logic model (also known as ‘theory of change’) underlying any intervention, treatment, or campaign aiming to change some aspect of people’s minds and/or behaviors. Specifically, the ABCD shows the assumed causal and structural assumptions, thereby showing what is assumed to cause what (e.g. which elements of the intervention are assumed to influence which aspects of the target population’s psychology?) and what is assumed to consist of what (e.g. which determinants are assumed to contain which specific aspects of the target population’s psychology?).
Just want a quick practical guide? See the most aptly named section “Practical Guide” below!
Background
Such ABCDs are generated from a uniform, machine readable, format: a table, for example as stored in a comma separated values (CSV) file. In it most extensive form, the table has the following columns:
- Behavior Change Principles (BCPs): The specific psychological principles engaged to influence the relevant sub-determinants, usually selected using the determinants to which the sub-determinants ‘belong’. These are also known as methods of behavior change in the Intervention Mapping framework, or behavior change techniques, BCTs, in the Behavior Change Wheel approach. For a list of 99 BCPs, see Kok et al. (2016).
- Conditions for effectiveness: The conditions that need to be met for a Behavior Change Principle (BCP) to be effective. These conditions depend on the specific underlying Evolutionary Learning Processes (ELPs) that the BCP engages (Crutzen & Peters, 2018). If the conditions for effectiveness (called parameters for effectiveness in the Intervention Mapping framework) are not met, the method will likely not be effective, or at least, not achieve its maximum effectiveness.
- Applications: Since BCP’s describe aspects of human psychology in general, they are necessarily formulated on a generic level. Therefore, using them in an intervention requires translating them to the specific target population, culture, available means, and context. The result of this translation is the application of the BCP. Multiple BCPs can be combined into one application; and one BCP can be applied in multiple applications (see Kok, 2014).
- Sub-determinants: Behavior change interventions engage specific aspects of the human psychology (ideally, they specifically, target those aspects found most important in predicting the target behavior, as can be established with plots. These aspects are called sub-determinants (the Intervention Mapping framework references Change Objectives, which are sub-determinants formulated according to specific guidelines). In some theoretical traditions, sub-determinants are called beliefs.
- Determinants: The overarching psychological constructs that are defined as clusters of specific aspects of the human psychology that explain humans’ behavior (and are targeted by behavior change interventions). Psychological theories contain specific definitions of such determinants, and make statements about how they relate to each other and to human behavior. There are also theories (and exists empirical evidence) on how these determinants can be changed (i.e. BCPs), so althought the sub-determinants are what is targeted in an intervention, the selection of feasible BCPs requires knowing to which determinants those sub-determinants belong.
- Sub-behaviors: The specific sub-behaviors that often underlie (or make up) the ultimate target behavior (called “Performance objectives” in Intervention Mapping). These are distinguished from the overarching target behavior because the relevant determinants of these sub-behaviors can be different: for example, the reasons why people do or do not buy condoms can be very different from the reasons why they do or do not carry condoms or why they do or do not negotiate condom use with a sexual partner.
- Behavior: The ultimate target behavior of the intervention, usually an umbrella that implicitly contains multiple performance objectives.
ABCDs can be generated using the [behaviorchange::abcd()] function in the behaviorchange R package.
They can also be generated from the online app that runs at https://a-bc.eu/apps/abcd.
Example
The ABCD matrix for this example is included in the behaviorchange package, and the identical table is available on Google Sheets.
behaviorchange::abcd(behaviorchange::abcd_specs_complete);
A simple but complete ABCD
The ABCD table for this ABCD is available at https://docs.google.com/spreadsheets/d/1U1j-VoiK3WmfveJ7VpUMY_H9WNXDh85a8jKbM67AQSI/edit#gid=0.
Practical Guide
Creating an ABCD matrix
To just get started, simply create a spreadsheet with seven columns. These columns represent the links of the causal/structural chain that represents you assumptions about why your intervention would work. You can use whichever column headings you want. The default headings are, from left to right:
- Behavior Change Principles (known as “Methods” in Intervention Mapping, and somewhat related to “Behavior Change Techniques” or “BCTs” from the Behavior Change Wheel);
- Conditions for effectiveness;
- Applications;
- Sub-determinants (often formulated as “Change Objectives” in Intervention Mapping);
- Determinants
- Sub-behaviors (known as “Performance Objectives” in Intervention Mapping)
- Target behavior
This spreadsheet is your ABCD matrix. You can now simply start filling it. Every line represents a causal/structural chain that explains 1) how you plan to change a sub-determinant and 2) how that change contributes to the ultimate behavior change. The ABCD matrix must be ‘rectangular’, which means that you cannot have empty cells. Of course, many cells will contain the same value; For example, you will likely have many cells in the “Determinants” column that contain “Attitude”. Cells with the exact same contents will be merged into the same ‘box’ in the visualisation as ABCD.
Note that you can use whichever spreadsheet programme you’re comfortable with; Microsoft Office Excel works fine, so does the free LibreOffice Calc, or SPSS, or you can use the online Sheets app from Google Docs, which is probably the best idea if you want to collaborate.
Instead of starting from scratch, you can also copy one of the examples, for example the one at
Creating an Acyclic Behavior Change Diagram
You can then generate the ABCD in two ways. The first is to use the free software R. In R, you can download and install the behaviorchange package, which contains the abcd function that imports a spreadsheet with an ABCD matrix and generates the diagram. However, if you don’t already use R this might not be convenient. Therefore, the Academy of Behavior Change also hosts an online app available at https://a-bc.eu/apps/abcd. In that app, you can import the spreadsheet in two ways.
First, you can import a so-called ‘comma separated values’ (.csv) file. This is an open standard for storing spreadsheets. You can export your spreadsheet from whichever programme you use (for example Excel, Calc, SPSS, or Google Sheets) as .csv file, which you can then import into the app (if you visit https://a-bc.eu/apps/abcd you’ll see a “Browse” button at the bottom that allows you to select and upload the file from your harddisk).
Second, you can ‘publish’ a Google Sheet so that it’s publically available, and then the app can directly import the data from your Google Sheet. This is of course much easier if you use Google Sheets in the first place. To do this, you have to do two things. First, share the Google Sheet, which you can do by clicking the Share button in the top-right corner. Indicate that you want to share by link, and select how you want to share it (normally, you only want to give people read-only access). A link is then created. Copy it, because you’ll need to paste it into the app. But you’re not done yet; you also have to ‘publish’ the sheet. To do this, click the File menu (or whatever it’s called in your language; the left-most menu) and select Publish to the web…. Indicate that you want to publish using a link (as opposed to embedding) and that you want to publish the entire document as a web page. The click Publish to publish the document. This is required to allow other servers to directly read the spreadsheet. Once you completed both steps, you can copy-paste the link (the one obtained through the Share settings, not the one obtained through the Publish settings) into the ABCD app at https://a-bc.eu/apps/abcd.
Whether you import a .csv file or use a link to a Published and Shared Google sheet, after you specified your ABCD matrix, you can click Create ABCD in the online app to let the app import the data.
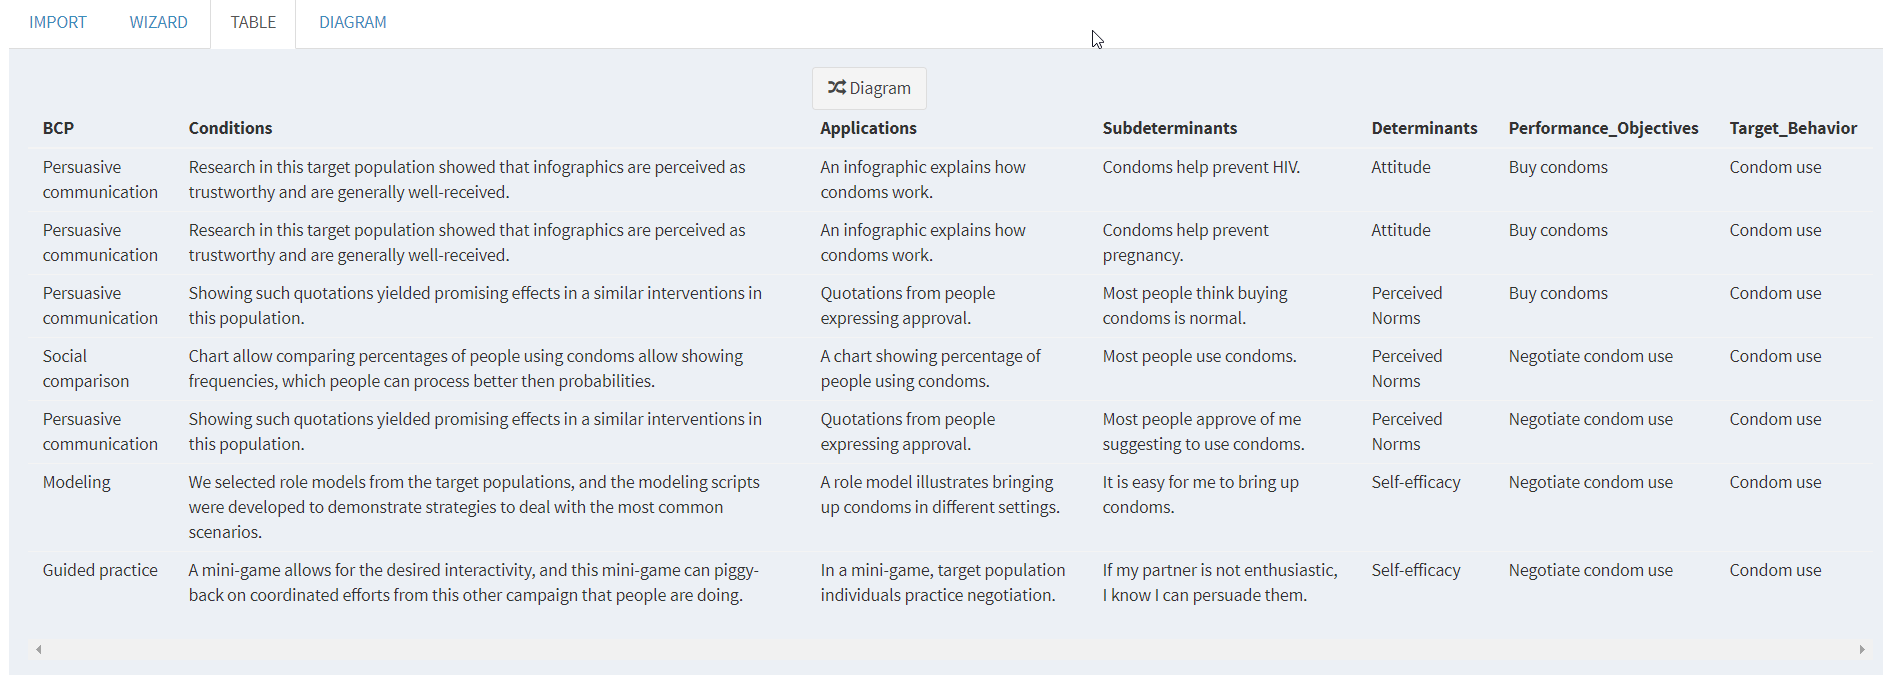
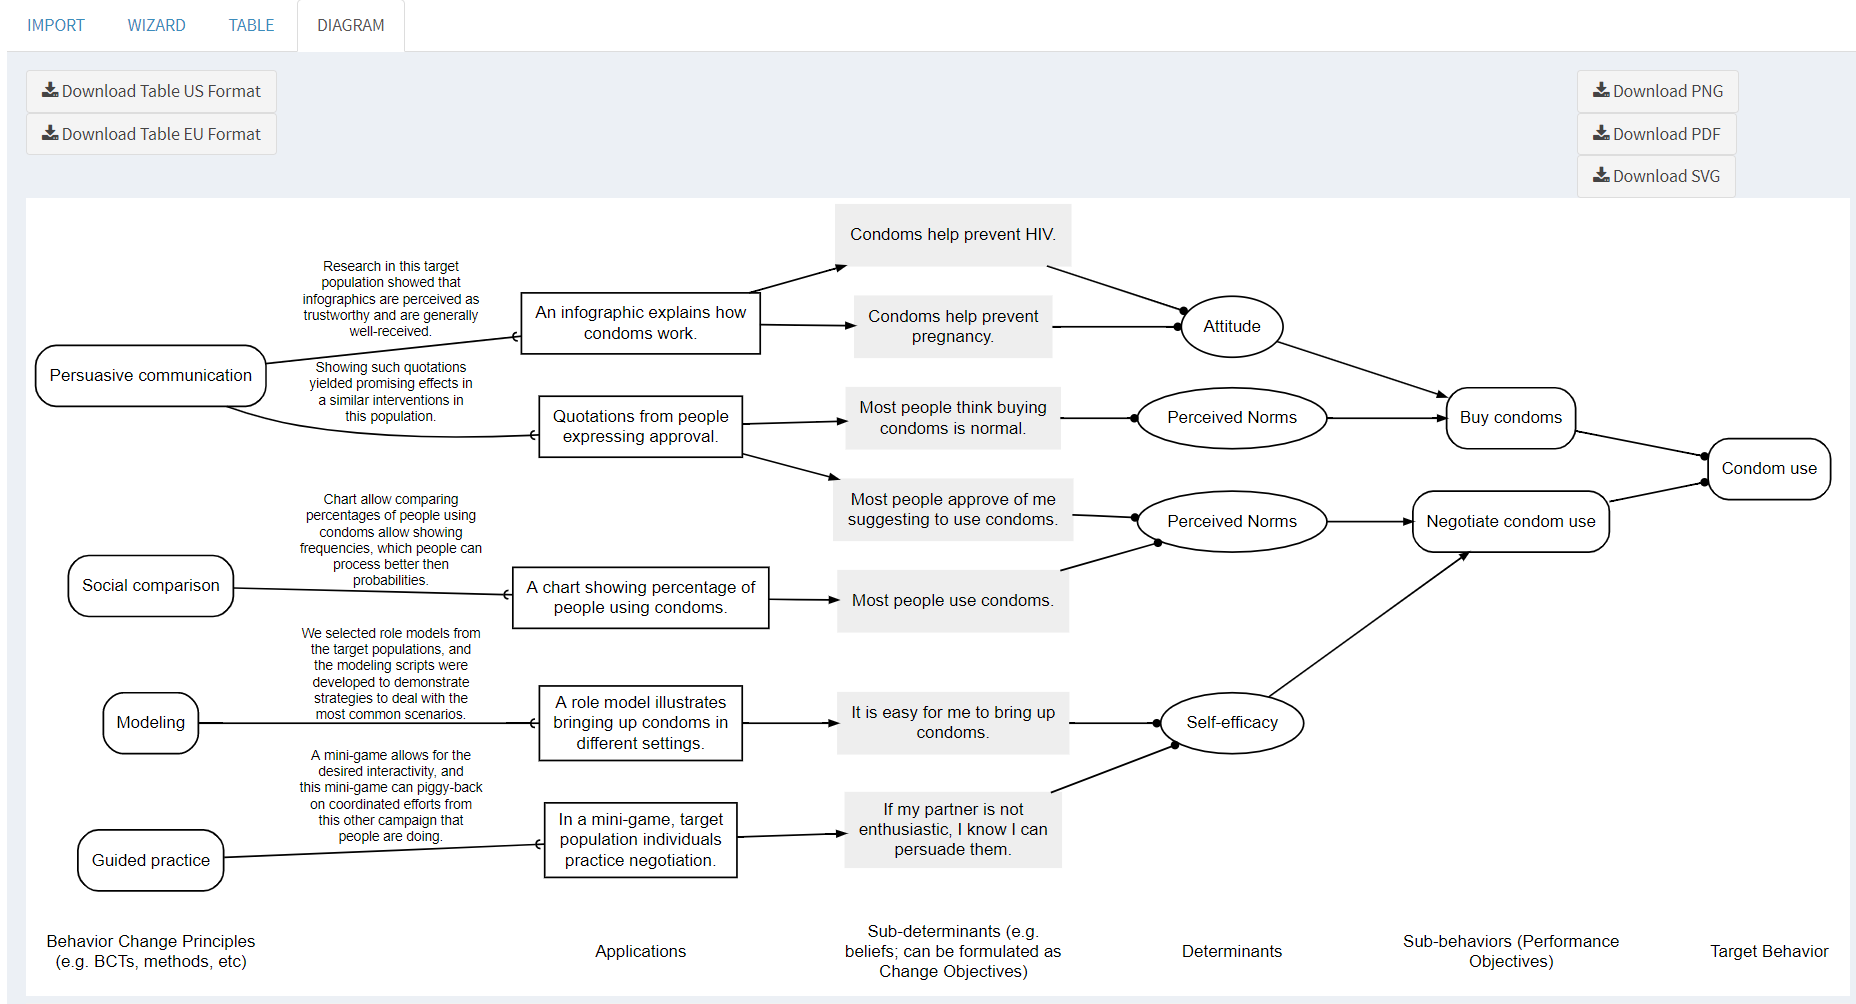
Once the ABCD matrix is imported, the app will show you a preview of the imported data, and you can click “Diagram” to generate the actual diagram, which you can then save to your hard disk. You can save to Scalable Vector Graphics format (.svg) if you still want to make edits. There exists an excellent free and open source SVG editor called InkScape that you can use to edit the file.
Example screenshots from the online app
This is a set of three screenshots showing the use of the online app. In this example, we use the Google Sheet at https://docs.google.com/spreadsheets/d/1U1j-VoiK3WmfveJ7VpUMY_H9WNXDh85a8jKbM67AQSI/edit#gid=0 (which has been Shared and Published conform the instructions above).
References
Crutzen, R., & Peters, G.-J. Y. (2018). Evolutionary learning processes as the foundation for behaviour change. Health Psychology Review, 12(1), 43–57.
Peters, G.-J. Y., & Crutzen, R. (2017). Pragmatic nihilism: how a Theory of Nothing can help health psychology progress. Health Psychology Review, 11(2).
Kok, G. (2014). A practical guide to effective behavior change: How to apply theory- and evidence-based behavior change methods in an intervention. European Health Psychologist, 16(5), 156–170.
Kok, G., Gottlieb, N. H., Peters, G.-J. Y., Mullen, P. D., Parcel, G. S., Ruiter, R. A. C., Fernández, M E., Markham, C., & Bartholomew, L. K. (2016). A taxonomy of behavior change methods: an Intervention Mapping approach. Health Psychology Review, 10(3), 297–312.


