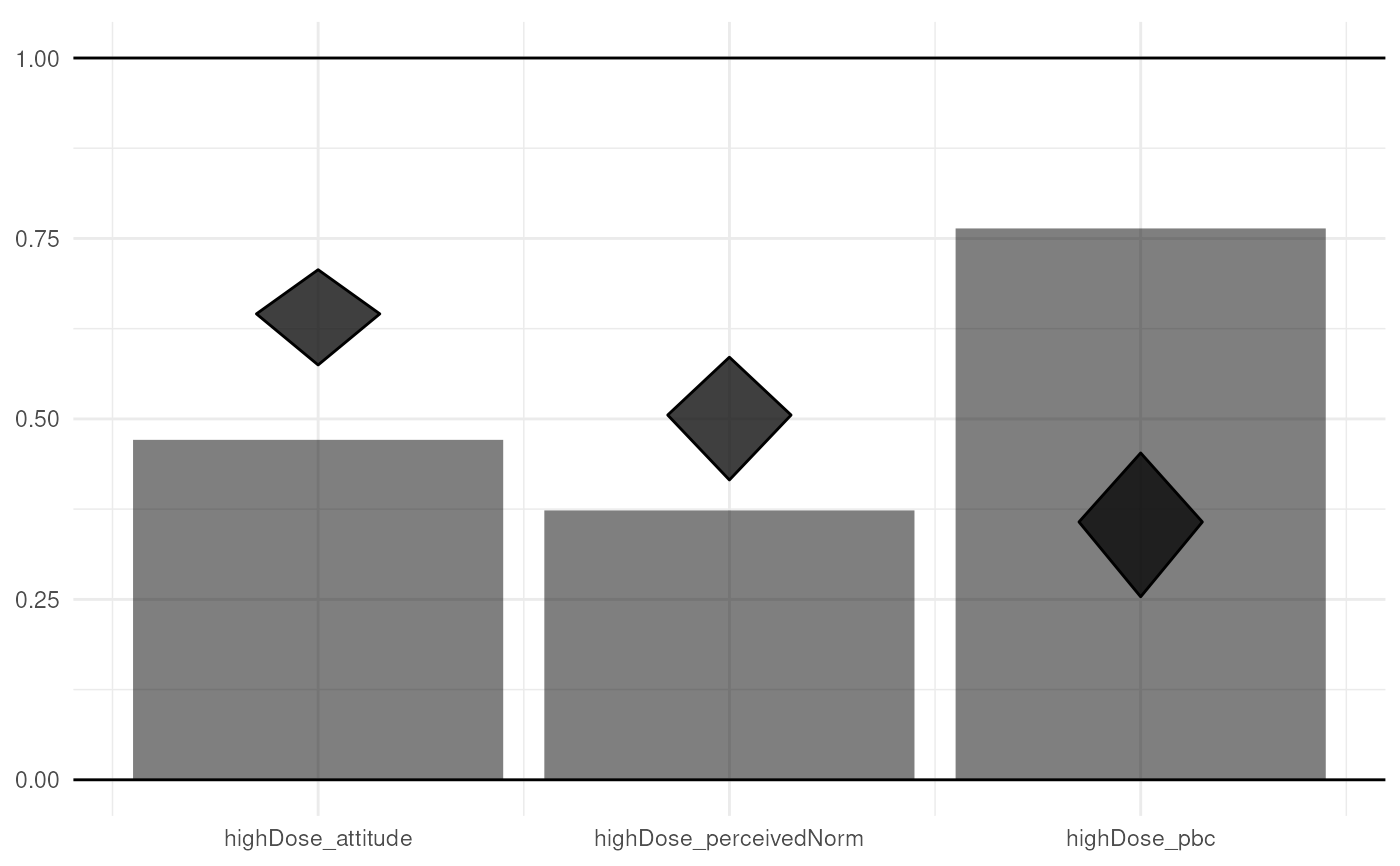
CIBERlite plots can be used to quickly get an idea of means and correlations of a small number of determinants. They were developed to facilitate conducting and interpreting determinant studies by prevention professionals.
CIBERlite(
  data,
  determinants,
  targets,
  determinantOrder = NULL,
  determinantLabels = NULL,
  subDeterminantLabels = NULL,
  title = NULL,
  conf.level = 0.95,
  scaleRange = NULL,
  determinantAesthetics = list(fill = "black", color = NA, alpha = 0.5),
  subDeterminantAesthetics = list(fill = "black", color = NA, alpha = 0.5),
  rDiamondAesthetics = list(fill = "#c4c4c4", color = NA, alpha = 0.75)
)
Arguments
- data
The dataframe containing the variables.
- determinants
Either a character vector with the names of the determinants, or a list of named character vectors, where each vector contains a number of subdeterminants, and each vector's name is the name of the more proximal determinant (i.e. that 'contains' those subdeterminants).
- targets
A character vector with the names of the targets (i.e. more proximal determinants, behavior, etc).
- determinantOrder
The order in which to display the determinants (if this needs to be different from the order as provided in
determinants).- determinantLabels
The labels to use for the determinants.
- subDeterminantLabels
The labels to use for the subdeterminants.
- title
The title of the plot.
- conf.level
The confidence levels: a list with two named values; the confidence level for the means, named
means, and the confidence level for the associations, namedassociations.- scaleRange
The full range of the scale of the determinants/subdeterminants; the minimum and maximum values are used if this is not provided.
- determinantAesthetics, subDeterminantAesthetics, rDiamondAesthetics
The aesthetics for the determinants, subdeterminants, and correlation diamonds, each a list containing three named values:
fill,color, andalpha.
Value
A ggplot.
Details
More details will be provided in a forthcoming paper; until then, see https://CIBERlite.com
